AD0-E208 Exam Questions & Answers
Adobe Analytics Business Practitioner Expert • Adobe
100% money-back guarantee
Sample AD0-E208 Questions
Practice with real exam-style questions, each with the verified correct answer and explanation.
The web analyst for a beauty products company wants to create a report to analyze the number of sample requests for one of their product pages.
The following items are available from the default configuration:
* prop3, which registers the product page name and is fired in the first page load
* eVar4, which registers the product page name and is fired in the first page load
* event1 2, which fires when a visitor clicks on "Request a sample'' call to action
How can the analyst accomplish the creation of this report?
The best way to create a report to analyze the number of sample requests for one of their product pages is to use eVar4 in combination with event12 as a metric. eVar4 registers the product page name and is fired in the first page load, so it will capture and persist the value for each visit. event12 fires when a visitor clicks on ''Request a sample'' call to action, so it will measure the number of sample requests. Using eVar4 as a dimension and event12 as a metric will show how many sample requests were made for each product page. Using prop3 instead of eVar4 will not work, as prop3 does not persist across hits or visits.
References: https://experienceleague.adobe.com/docs/analytics/components/variables/conversion-variables/conversion-var-overview.html?lang=en https://experienceleague.adobe.com/docs/analytics/components/variables/traffic-variables/traffic-var-overview.html?lang=en
A business owner is reviewing quarterly financial data and looks to complete projections for the upcoming quarter.
Which tool should be used to enable this analysis?
Adobe Experience Platform is a tool that enables data integration, analysis, and visualization across different sources and channels. It can help business owners to review historical data and create projections for the future.
References: https://experienceleague.adobe.com/docs/experience-platform/landing/home.html?lang=en
Refer to the exhibit:
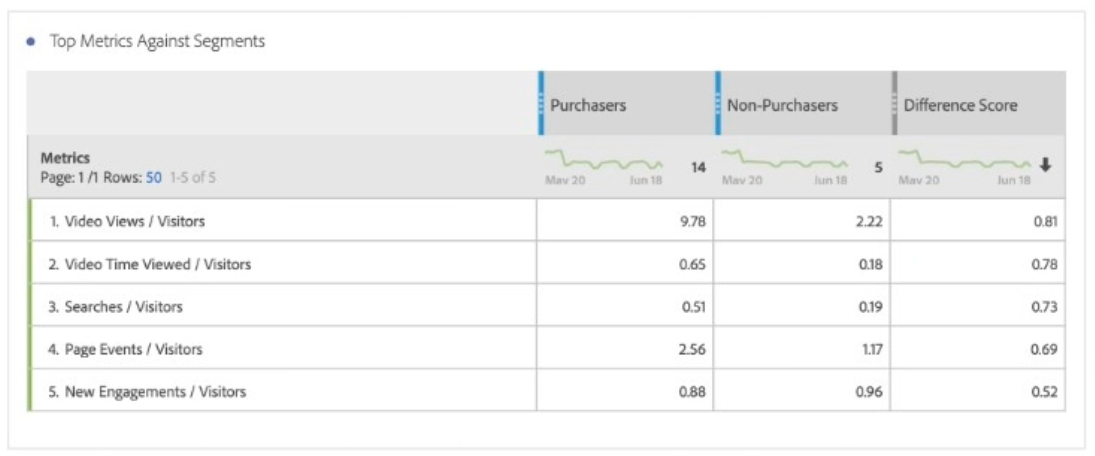
What is a valid interpretation of this Segment Comparison between Purchasers and Non-Purchasers segments?
A valid interpretation of this Segment Comparison between Purchasers and Non-Purchasers segments is that on average, Purchasers view 81 % more videos than Non-Purchasers. This means that the average Video Views per Visitor for Purchasers is 81 % higher than that for Non-Purchasers. Video Views/Visitors is not the most statistically significant difference between the two segments, as it has a low confidence level of 68 %. Purchasers are not 81 % more likely to complete a Video View than Non-Purchasers, as this would imply a probability or conversion rate, not an average.
References: https://experienceleague.adobe.com/docs/analytics/analyze/analysis-workspace/components/segment-comparison.html?lang=en https://experienceleague.adobe.com/docs/analytics/analyze/analysis-workspace/components/segment-comparison.html?lang=en#interpreting-segment-comparison-results
Refer to the exhibit.
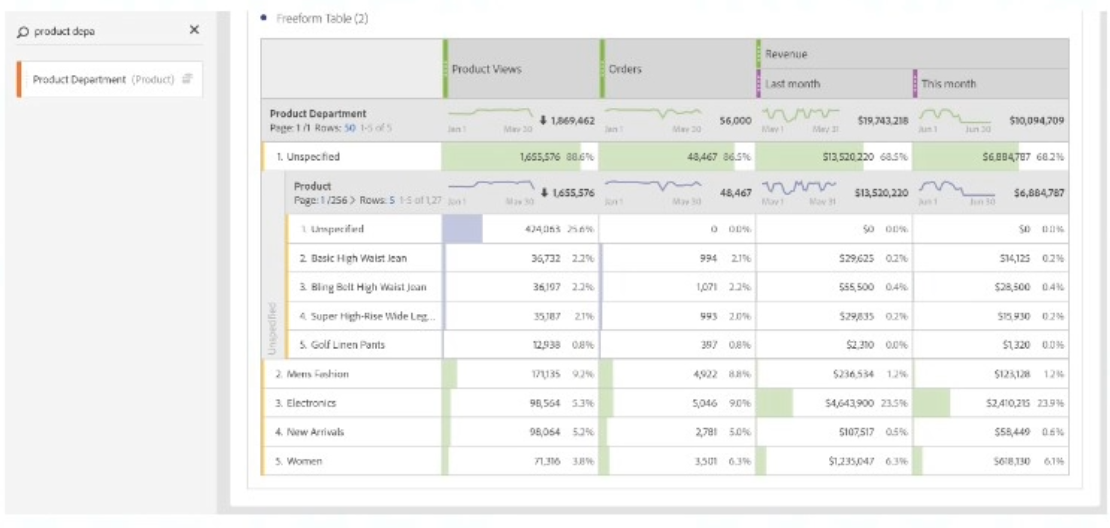
Analyzing results from multinational e-commerce, a data analyst realizes much of the product view results and orders are being mapped to an "Unspecified" department name.
What is the probable cause?
Product Department is a classification of product data that can be used to group products into meaningful categories. If some products are showing up as ''Unspecified'' in the report, it means that they are not correctly classified or updated in the classification file.
References: https://experienceleague.adobe.com/docs/analytics/components/classifications/classifications-overview.html?lang=en
Which option would an analyst choose to show the percentage change between the two numbers in a visualization?
The Summary Change visualization shows the difference between two numbers in a report, such as current period vs previous period. To show the percentage change between the two numbers, you need to click the Visualization settings and select Show Percent Change.
References: https://experienceleague.adobe.com/docs/analytics/analyze/analysis-workspace/visualizations/summary-change.html?lang=en
Get access to all 50 verified questions with detailed answers.
Unlock All AD0-E208 Questions