QSBA2024 Exam Questions & Answers
Qlik Sense Business Analyst Certification Exam - 2024 • Qlik
100% money-back guarantee
Sample QSBA2024 Questions
Practice with real exam-style questions, each with the verified correct answer and explanation.
A customer needs to distribute sales data to a variety of teams. The internal analyst team requires a global view of dat
a. The sales team requires mobile device access.
Which solution will meet the needs of both teams?
To meet the needs of both the internal analyst team and the sales team, the best solution is to create two separate apps: one designed specifically for mobile use and another for internal use. Mobile devices require different UI considerations, such as simpler, touch-optimized layouts, while the internal team can benefit from a more detailed app optimized for desktop use. Designing separate apps ensures that both teams have a tailored experience that suits their specific devices and use cases.
Key Concepts:
Mobile Optimization: Mobile devices require apps that are streamlined and optimized for smaller screens, while internal users on desktop computers can handle more complex layouts and detailed reports.
Separate Apps: Creating separate apps ensures that each team gets the best user experience tailored to their needs.
Why the Other Options Are Less Suitable:
A . One app with a specific extension for mobile users: While extensions can provide some mobile functionality, they don't offer the flexibility and optimization needed for a fully mobile-friendly experience.
C . A mashup with various objects: A mashup may provide flexibility, but it could be overly complex for this requirement and wouldn't necessarily offer an optimal mobile experience.
D . One app with various objects: This could complicate the user experience for both teams, as mobile users may struggle with objects that are not optimized for their devices.
References for Qlik Sense Business Analyst:
Mobile vs. Desktop App Design: Qlik Sense recommends optimizing apps for specific devices to ensure the best user experience for both desktop and mobile users.
Thus, B is the correct answer because it provides the best solution for both the mobile sales team and the internal analyst team, making it the verified answer.
The VP of Sales asks a business analyst to include a KPI object on the sales dashboard that shows total sales value for the year 2022, regardless of selections. Existing fields in the data model include Sales and Year.
How should the business analyst write the measure for the KPI object?
In this scenario, the VP of Sales wants to see the total sales for the year 2022 regardless of selections. This requirement is best handled using Set Analysis in Qlik Sense. The key to achieving this is using the set identifier 1, which ignores the user's selections and ensures the calculation is based on the entire dataset. The expression Sum( { 1 < year = { '2022' } > } Sales) calculates the sum of sales for the year 2022, irrespective of any other selections made in the app.
Key Concepts:
Set Identifier 1: This identifier ensures that the calculation is performed on the entire dataset, ignoring any selections or filters applied by the user.
Year Filtering: The expression < year = { '2022' } > ensures that only sales from the year 2022 are included in the calculation.
Why the Other Options Are Less Suitable:
A . Sum( { < year = '2022' > } Sales): This is incorrectly formatted, and the pipe (|) symbol should not be used in this context.
B . Sum( { $ < year = { '2022' } > } Sales): The $ set identifier respects the current selections, which is not what is needed in this case, as the VP wants the value to be shown regardless of selections.
D . Sum( 1 { < year = { '2022' } > } Sales): The placement of 1 is incorrect in this expression.
References for Qlik Sense Business Analyst:
Set Analysis: Qlik Sense's Set Analysis allows analysts to control what data is used in a calculation, regardless of user selections. The set identifier 1 ensures that selections are ignored, which is essential for showing fixed data such as total sales for a specific year.
Thus, the correct expression to show the total sales for 2022, regardless of user selections, is C.
Refer to the exhibit.
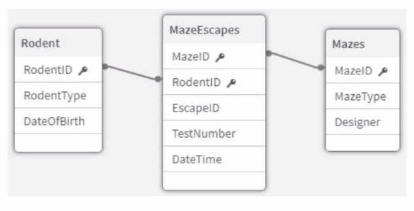
An app that will track experiments for rodents (e.g., rats and mice) that navigate mazes (labyrinths) is being developed. Individual rodents are catalogued in the Rodent table, while the Mazes table has metadata for the mazes. The MazeEscapes table holds a record of each attempt at a maze by a rodent. A business analyst needs to build a KPI that will allow users to see how many rodents have made at least one attempt at any maze.
How should the analyst construct the KPI?
In this case, we need to count how many unique rodents have made at least one attempt at any maze. Since the relationship between the Rodent table and the MazeEscapes table is a one-to-many relationship (each rodent may attempt several mazes), the best approach is to base the calculation on the MazeEscapes table, as it holds the actual records of rodent attempts.
By creating a new field RodentID_Counter in the MazeEscapes table, the analyst ensures that each rodent's attempt is captured. Using the Count (Distinct RodentID_Counter) as the KPI expression then accurately counts each unique rodent that has made at least one attempt, without counting multiple attempts by the same rodent.
Key Concepts:
Distinct Count: The distinct count ensures that rodents who have made multiple maze attempts are only counted once.
MazeEscapes Table: This table holds the records of each attempt, making it the correct source for this KPI.
Why the Other Options Are Less Suitable:
B . Sum (RodentID_Counter) in the Rodent table: This would incorrectly sum the number of rodents rather than counting unique attempts, leading to inaccurate results.
C . Sum (RodentID_Counter) in the MazeEscapes table: Summing the counter would not account for the distinct rodents, leading to incorrect counting.
D . RodentID_Counter in the Rodent table: This would not correctly reflect the rodents that have made an attempt, as not every rodent in the Rodent table may have attempted a maze.
References for Qlik Sense Business Analyst:
Distinct Count in KPI: It is best practice to use Count(Distinct ...) when working with KPIs that require unique counts, such as counting distinct rodents in this scenario.
Thus, A is the verified answer because it ensures that each rodent is counted once, based on their attempts in the MazeEscapes table.
A business analyst needs to create two side-by-side charts for a sales department with the following data:
* Number of orders
* Name of the customer
* Percentage of margin
* Total sales
The charts use a common dimension, but each chart has different measures. The analyst needs to create a color association between the two charts on the dimension values.
Which action should the business analyst take?
In Qlik Sense, the 'By Dimension' and 'Persistent colors' options in the Colors property panel ensure that the same dimension values have the same color across multiple charts. This is especially useful when you have two or more side-by-side charts sharing a common dimension, like customer names in this case. Persistent colors guarantee consistency in color assignment, helping users visually track the same dimension across different visualizations.
Key Concepts:
By Dimension: This option ensures that each unique value of a dimension (e.g., customer name) gets a distinct color across all charts that use this setting.
Persistent Colors: This feature ensures that the colors remain the same between charts, making the visual comparison across charts easier for the users.
Why the Other Options Are Less Suitable:
A . Use nested IF statements to set the colors by expression for each dimension value: While this would work, it would be unnecessarily complex to maintain and manage, especially with many dimension values.
B . Define the color values in the master measures and use the color library: This would only apply if the goal was to set colors based on measures, not dimensions. In this case, dimension consistency is required, not measure-based coloring.
D . Use the FieldIndex function to set the colors by expression for each dimension value: This would involve writing complex expressions that would not be as straightforward as using the built-in functionality of 'By Dimension' and 'Persistent colors'.
References for Qlik Sense Business Analyst:
Color Consistency Across Charts: The 'By Dimension' and 'Persistent colors' settings are recommended in Qlik Sense documentation when creating multi-chart layouts with shared dimensions, ensuring visual coherence across different charts.
The Persistent colors and By Dimension settings offer a straightforward and maintainable way to create color associations across charts, making option C the verified solution.
The business analyst creates one table by concatenating and joining several source tables. This has resulted in a table of several thousand rows that may have several columns containing between 30% and 70% null values. The business analyst needs to understand the level of null values in each field of this table to determine if this is an issue.
Which capability should the business analyst use?
The Density value in the Data Model Viewer provides a measure of how 'dense' or 'sparse' a field is in terms of data completeness. A higher density value means fewer nulls, while a lower value indicates more nulls. By checking the density value for each field, the business analyst can determine the percentage of non-null values, which is critical for understanding data quality and completeness.
Key Concepts:
Density Value: This is a measure in Qlik Sense that indicates the proportion of non-null values in a field. A field with a high density is mostly populated, while a lower density indicates a high proportion of null values.
Data Model Viewer: This tool allows analysts to inspect the structure and quality of data fields, including metrics such as density.
Why the Other Options Are Less Suitable:
B . Preview Panel: While the Preview Panel shows sample data, it does not provide a comprehensive measure of null values and is more suited for a quick glance rather than detailed analysis.
C . Tags fields with $null: This would show if the field contains any nulls, but it wouldn't quantify the level of nulls.
D . Subset Ratio: The subset ratio compares values across related tables, not null values within individual fields.
References for Qlik Sense Business Analyst:
Data Quality in Qlik Sense: Using the Density value is the best way to assess the proportion of null values in a field, making it ideal for the business analyst to understand the completeness of the data.
Thus, A is the correct answer because the density value provides the required insight into the level of nulls in each field.
Get access to all 50 verified questions with detailed answers.
Unlock All QSBA2024 Questions