DA0-001 Exam Questions & Answers
CompTIA Data+ Certification Exam • CompTIA
100% money-back guarantee
Sample DA0-001 Questions
Practice with real exam-style questions, each with the verified correct answer and explanation.
Alex wants to use data from his corporate sale, CRM, and shipping systems to try and predict future sales.
Which of the following systems is the most appropriate?
Choose the best answer.
Correct answer: C. Data Warehouse.
Data warehouse bring together data from multiple systems used by an organization.
A data mart is too narrow, as Alex needs data from across multiple divisions.
OLAP is a broad term of analytical processing, and OLTP systems are transactional and not ideal for this task.
An analyst is designing a dashboard to determine which site has the highest percentage of new customers. The analyst must choose an appropriate chart to include in the dashboard. The following data is available:
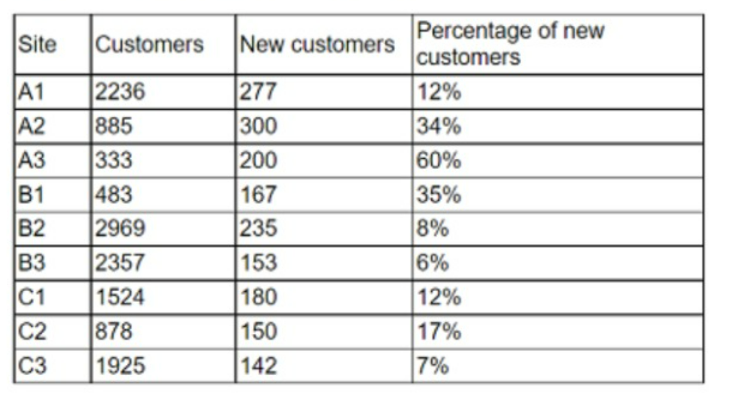
Which of the following types of charts should be considered to best display the data?
The best type of chart to display the data is A. Include a bar chart using the site and the percentage of new customers data.
A bar chart is a good choice for comparing categorical data with numerical data, such as the site and the percentage of new customers. A bar chart can show the relative differences between the sites and highlight the site with the highest percentage of new customers. A bar chart can also be easily labeled and formatted to make the data clear and understandable.
A line chart is not suitable for this data, because it is used to show trends or changes over time, which is not relevant for the site and the percentage of new customers data. A line chart would also be confusing and misleading, as it would imply a connection or correlation between the sites that does not exist.
A pie chart is also not a good choice for this data, because it is used to show the proportion of a whole, not the comparison of different categories. A pie chart would also be difficult to read and interpret, as it would require labels or legends to identify the sites and their percentages. A pie chart would also not be able to show the exact values of the percentages, only their relative sizes.
A scatter chart is another inappropriate option for this data, because it is used to show the relationship or correlation between two numerical variables, not between a categorical and a numerical variable. A scatter chart would also be cluttered and unclear, as it would plot each site as a point on a coordinate plane, without any labels or axes. A scatter chart would also not be able to show the differences or rankings between the sites and their percentages.
An analyst wants to test the association between the number of doors in a car and the number of gears in the car. Which of the following is the best test to use?
The Chi-squared test is used to determine whether there is a statistical association between two categorical variables. In this case, both 'number of doors' and 'number of gears' are categorical variables, making the chi-squared test the appropriate method.
Which of the following techniques is used to quantify data?
Answer : C . Coding
Coding is a technique that is used to quantify data, especially qualitative data that are not expressed numerically. Coding involves assigning codes, such as numbers, letters, symbols, or colors, to different categories or themes that emerge from the data. For example, if you have a set of survey responses that ask about the satisfaction level of customers, you can code them as follows:
Very satisfied = 5
Satisfied = 4
Neutral = 3
Dissatisfied = 2
Very dissatisfied = 1
By coding the data, you can convert them into quantitative data that can be analyzed using statistical methods, such as calculating the mean, median, mode, frequency, or percentage of each category12.
Option A is incorrect, as decoding is not a technique that is used to quantify data, but rather a process of interpreting or translating data from one form to another.For example, decoding can involve converting binary codes into text or images, or decrypting ciphertext into plaintext3.
Option B is incorrect, as enumeration is not a technique that is used to quantify data, but rather a process of listing or naming data in a specific order.For example, enumeration can involve listing the names of the states in alphabetical order, or naming the planets in order of their distance from the sun4.
Option D is incorrect, as structure is not a technique that is used to quantify data, but rather a property or characteristic of data that describes how they are organized or arranged. For example, structure can refer to the format, type, or schema of data, such as structured, semi-structured, or unstructured data.
A sales director has requested a report for individual team members within the division be developed. The director would like the report to be shared with all team members, but individual team members should not be identifiable within the report Which of the following access requirements would support the director's needs?
Get access to all 363 verified questions with detailed answers.
Unlock All DA0-001 Questions