Analytics-DA-201 Exam Questions & Answers
Salesforce Certified Tableau Data Analyst • Salesforce
100% money-back guarantee
Sample Analytics-DA-201 Questions
Practice with real exam-style questions, each with the verified correct answer and explanation.
You want to create the following table in a view.
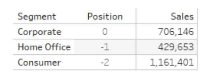
Which function should you use to create the Position column?
To create the Position column, you should use the FIRST () function. The FIRST () function returns the number of rows from the current row to the first row in the partition. For example, the first row in a partition will return 0, the second row will return -1, and so on. In this question, the partition is defined by the Segment field, and the table is sorted by the Sales field in descending order. Therefore, the Position column shows the offset of each row from the first row in each segment, based on the sales ranking.Reference:
Tableau Certified Data Analyst Exam Prep Guide, page 11, section ''Creating Calculated Fields''
SIMULATION
Open the link to Book1 found on the desktop. Open SalesVSProfit worksheet.
Add a distribution band on Profit to show the standard deviation from- 1 to 1.
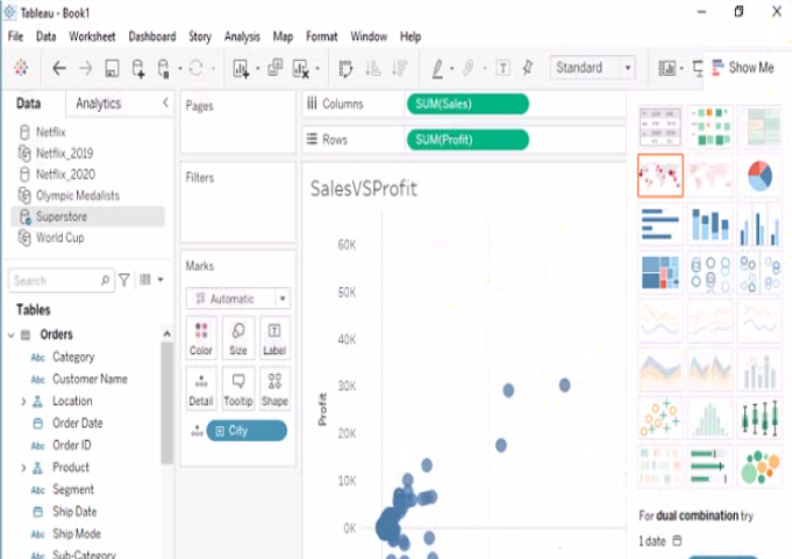
To add a distribution band on Profit to show the standard deviation from -1 to 1, you need to do the following steps:
Open the link to Book1 found on the desktop. This will open the Tableau workbook that contains the SalesVSProfit worksheet.
Click on the SalesVSProfit tab at the bottom of the workbook to open the worksheet. You will see a scatter plot that shows the relationship between Sales and Profit for each Sub-Category.
Click on the Analytics tab on the left side of the workbook to open the Analytics pane. You will see a list of analytical objects that you can drag and drop onto your worksheet.
Drag Distribution Band from the Analytics pane to Profit on the Rows shelf. This will add a distribution band on Profit that shows the average and confidence interval for each Sub-Category.
Click on the Edit button on the distribution band to open the Edit Distribution Band dialog box. You will see options to customize your distribution band.
Change the Band From value to -1 and the Band To value to 1. This will change the distribution band to show the standard deviation from -1 to 1, which means one standard deviation below and above the average.
Click OK to apply the changes. You will see that the distribution band now shows a narrower range of values for Profit.
Which syntax should a Data Analyst use to find the first purchase date per customer when Customer is not in the view?
Below are some of the values in the Order_ID field:
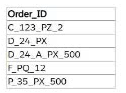
Which calculation should a Data Analyst use to return the two-letter combinations starting with the letter "P" for each of these values?
You have the following data source in tableau Server.
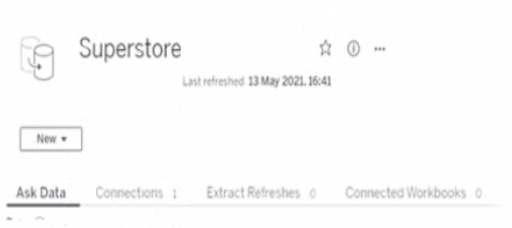
You need to ensure that the data is updated every hour.
What should you select?
To ensure that the data is updated every hour on Tableau Server, you would need to go to the 'Extract Refreshes' option. Here, you can schedule the data extracts to refresh at the desired frequency, which in this case would be every hour.
Get access to all 174 verified questions with detailed answers.
Unlock All Analytics-DA-201 Questions