Applied-Algebra Exam Questions & Answers
WGU Applied Algebra • WGU
100% money-back guarantee
Sample Applied-Algebra Questions
Practice with real exam-style questions, each with the verified correct answer and explanation.
The number of people auditioning for a game show is expected to be 3 less than the number of people who auditioned last year. The function can be used to model the situation, where represents the number of people who auditioned last year and represents the number of people expected to audition this year.
Which quantity represents the number of people expected to audition this year, given that 280 people auditioned last year?
The function represents the number of people expected to audition this year.
The input represents the number of people who auditioned last year.
The problem says this year's number is expected to be 3 less than last year's number. Therefore, the function rule is:
We are told that 280 people auditioned last year, so:
Substitute into the function:
So, the notation that represents the number of people expected to audition this year is:
This means if 280 people auditioned last year, then 277 people are expected to audition this year.
Therefore, the correct answer is:
A company provides internet service to approximately 1,050 customers each year. The table shows the percentage of customers with fiber internet each year since 2020.
Years since 2020 Percent of Customers with Fiber
0 19
1 28
2 40
3 57
What was the approximate number of customers with fiber internet in 2023?
The table gives the percent of customers with fiber internet for each year since 2020.
Since 2023 is:
20232020=3
we use the row where:
Years since 2020=3
From the table, the percent of customers with fiber internet in 2023 is:
57%
The company has approximately:
1,050
customers each year.
Now find 57% of 1,050:
0.571,050=598.5
The closest answer choice is:
598
So approximately 598 customers had fiber internet in 2023.
Therefore, the correct answer is:
C
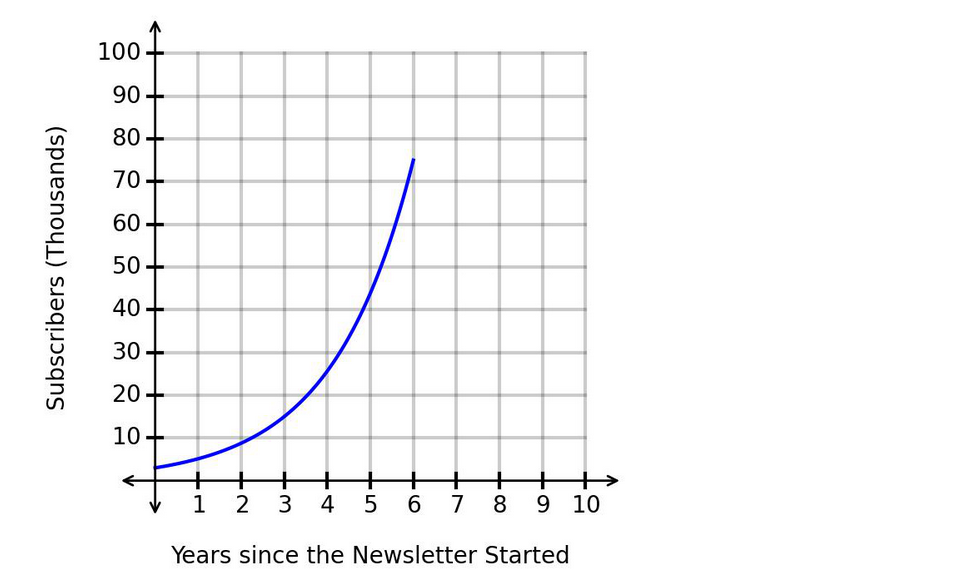
The function models the number of subscribers to a virtual newsletter over time. The graph of is shown. The horizontal axis represents the number of years since the newsletter started, and the vertical axis represents the number of subscribers, in thousands.
How is the number of subscribers changing over time based on the graph?
The graph shows an increasing exponential curve.
The number of subscribers is going up as time passes, so the function is increasing.
Also, the graph becomes steeper as time increases. This means the rate of increase is getting larger.
So the number of subscribers is:
This is a key feature of exponential growth.
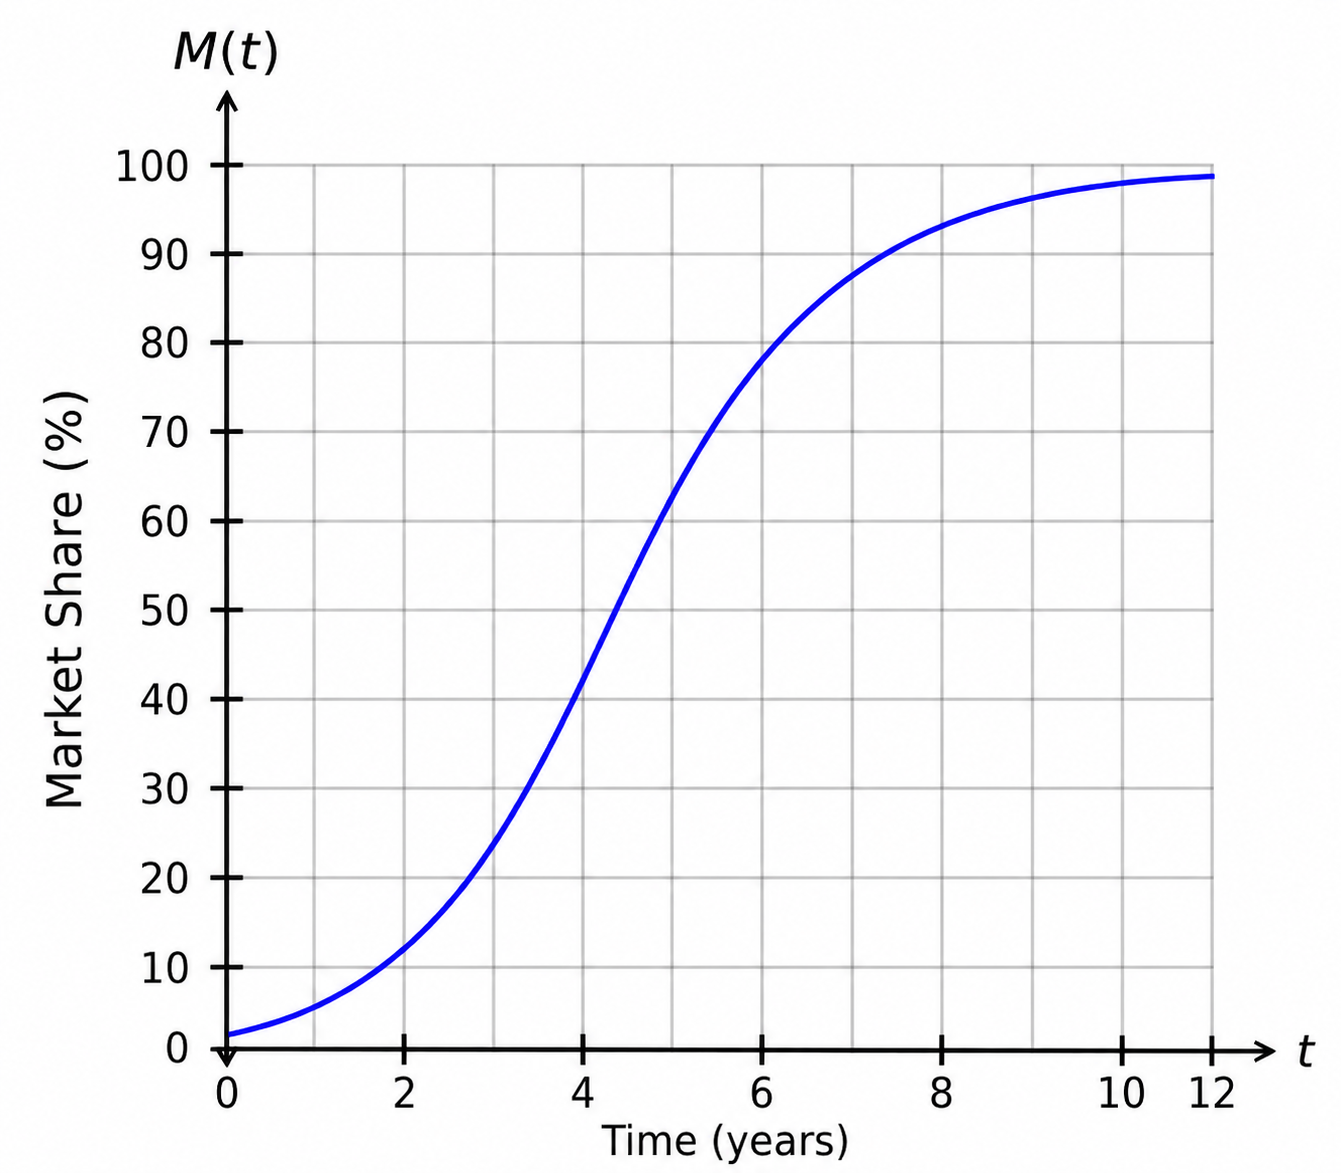
A new company just launched and is using the function to predict its market share after years. The graph of is shown.
When should the company expect to have a market share of ?
The function represents the company's predicted market share after years.
The horizontal axis represents:
The vertical axis represents:
We need to find when the company's market share reaches:
To answer this from the graph:
Locate on the vertical axis.
Move horizontally until reaching the blue curve.
Move downward to the horizontal axis to read the corresponding time.
From the graph, the blue curve reaches a little after years, approximately at:
So the company should expect to have a market share of after about:
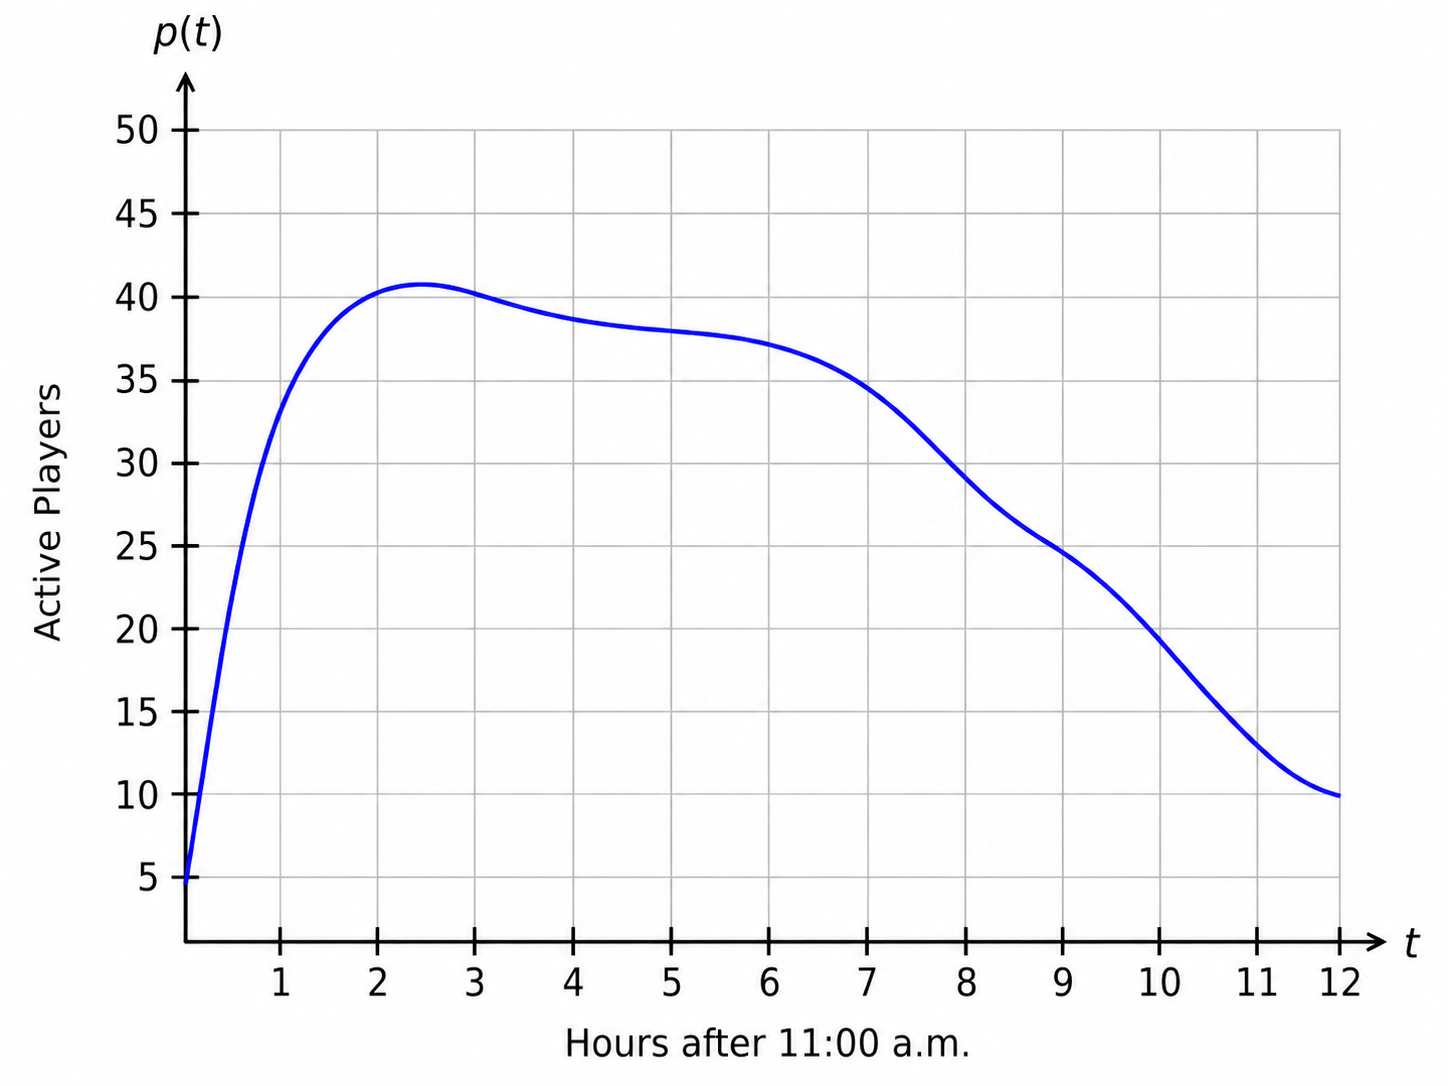
Consider the graph of shown. The function represents the number of active players, , in a game hours after 11:00 a.m.
Which interpretation of the concavity between and is correct?
The graph represents:
where:
We need to interpret the concavity between:
and
On this interval, the graph is rising, so the number of players is increasing.
But as the graph rises, it begins to level off near the top. This means the rate of increase is getting smaller.
So the number of players is not increasing faster and faster. Instead, it is increasing, but more slowly as time passes.
That means the graph is concave down on this interval.
The correct interpretation is:
Get access to all 94 verified questions with detailed answers.
Unlock All Applied-Algebra Questions