FCSS_NST_SE-7.6 Exam Questions & Answers
Fortinet NSE 6 - Network Security 7.6 Support Engineer • Fortinet
100% money-back guarantee
Sample FCSS_NST_SE-7.6 Questions
Practice with real exam-style questions, each with the verified correct answer and explanation.
Refer to the exhibit.

Partial output of the fssod daemon real-time debug command is shown. Which two conclusions can you draw from the output? (Choose two answers)
The correct answers are C and D.
The key clue is the command itself:
diagnose debug application fssod -1
The study guide explicitly states: ''There is a specific FortiGate daemon that handles the polling mode. It is the fssod daemon. To enable agentless polling mode real-time debug use the command: diagnose debug application fssod -1.''
That directly proves D. FSSO is using agentless polling mode to detect logon events.
The study guide also states: ''In agentless polling mode, FortiGate frequently polls all workstations (as a standalone collector agent does) to check which users are still logged in. You can sniffer this traffic on port 445.''
That directly proves C. FortiGate is frequently polling the workstation in case the user has logged out.
Why the other options are wrong:
A is wrong because the ''cannot verify if the user is still logged in'' / Not Verified condition is described for the collector agent workstation status, not as a conclusion from this FortiGate fssod debug line. The study guide says: ''A user goes to not verified status when they log out, or when there is a problem in the polling done by the collector agent to the workstation.''
B is wrong because DC Agent mode is part of agent-based FSSO, where DC agents send events to a collector agent. This output is from the fssod daemon, which the study guide ties to agentless polling mode, not DC Agent mode.
E is wrong because TCP port 8000 is used for communication between the collector agent and FortiGate, while in agentless polling mode FortiGate polls workstations and that traffic can be sniffed on TCP port 445.
So the verified answers are: C, D.
What can cause an IKEv2 tunnel to go down after it was initially brought up successfully?
The correct answer is A.
The study guide explains the IKEv2 exchange order very clearly:
''The initial exchanges are: IKE_SA_INIT and IKE_AUTH.''
''Create_Child_SA exchange: Creates a new child SA or rekeys an existing child SA.''
It also states:
''After successful IKE_SA_INIT and IKE_AUTH exchanges, the CHILD_SA exchange takes place. In this exchange, the peers negotiate the CHILD_SA and the traffic selectors --- traffic selector responder (TSr) and traffic selector initiator (TSi).''
That is why A is correct: if the tunnel was initially brought up successfully, then the initial exchanges already succeeded. A later problem during CREATE_CHILD_SA, especially with traffic selectors/phase 2 selectors, can cause the tunnel to fail during rekey or child-SA renegotiation.
Why the other options are wrong:
B is wrong because proposal mismatch for the IKE SA is handled during IKE_SA_INIT, not after the tunnel is already up. The study guide says IKE_SA_INIT negotiates the security settings to protect the IKE traffic
C is wrong because a pre-shared key mismatch is part of authentication and would prevent successful initial establishment during IKE_AUTH. The study guide shows that after IKE_AUTH, ''authentication succeeded'' and ''established IKE SA'' when it works
D is wrong because a Diffie-Hellman mismatch belongs to IKE_SA_INIT, which happens before the tunnel comes up. The study guide also states: ''By IKEv2 design, no Diffie-Hellman public key is exchanged during an IKE_AUTH exchange.''
So the verified answer is: A.
Refer to the exhibit.
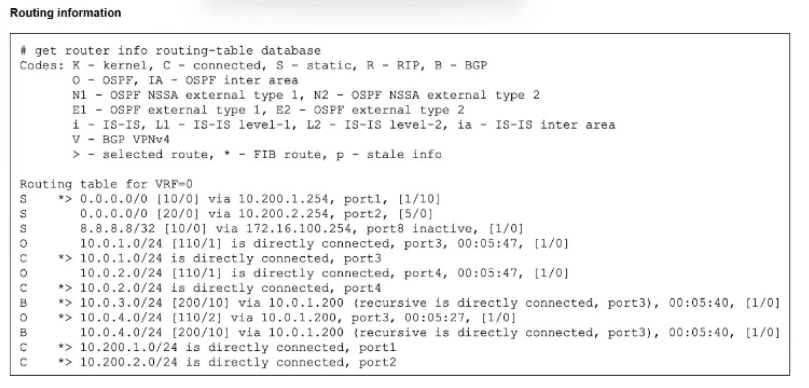
The modified output of live routing kemel is shown
Which two statements about the output are (rue? (Choose two.)
We must analyze the flags (*, >, S, O, B) and Administrative Distances (AD) shown in the get router info routing-table database exhibit to determine the correct statements.
Analysis for Option A (The BGP route to 10.0.4.0/24 is not in the forwarding information base):
True. Look at the entry for 10.0.4.0/24.
There is an OSPF route: O *> 10.0.4.0/24 [110/2]. The * indicates it is in the FIB, and > indicates it is the selected route.
There is a BGP route: B 10.0.4.0/24 [200/10]. This line lacks the * flag.
Reason: The OSPF route has an Administrative Distance of 110. The BGP route (iBGP) has an AD of 200. Since 110 is lower than 200, OSPF wins, and the BGP route is not installed in the Forwarding Information Base (FIB).
Analysis for Option B (The default static route through 10.200.1.254 is in the forwarding information base):
True. Look at the 0.0.0.0/0 entries.
The first entry is S *> 0.0.0.0/0 [10/0] via 10.200.1.254.
The * flag confirms this specific route is installed in the FIB.
The second static route (via 10.200.2.254) has a higher distance ([20/0]) and no * flag, so it is inactive.
Why C is False: ECMP (Equal Cost Multi-Path) requires routes to have the same cost/priority. Here, one static route has AD 10 and the other has AD 20. They are not equal, so ECMP is not performed.
Why D is False: The routing table database shows active routes, not the raw Link State Advertisement (LSA) database. You cannot determine the number of LSAs received solely from this output.
FortiGate Security 7.6 Study Guide (Routing): 'The routing table database displays all known routes... The * indicates the route is in the FIB... Lower Administrative Distance is preferred.'
What is the diagnose test application ipsmonitor 5 command used for? (Choose one answer)
The correct answer is D.
The study guide shows the ipsmonitor test usage exactly:
1: Display IPS engine information
2: Toggle IPS engine enable/disable status
5: Toggle bypass status
99: Restart all IPS engines and monitor
So diagnose test application ipsmonitor 5 is used to toggle bypass status, which corresponds to enabling IPS bypass mode.
Why the other options are wrong:
A is wrong because disabling the IPS engine is option 2, not 5.
B is wrong because the study guide does not define option 5 as IPS session information.
C is wrong because restarting all IPS engines and monitors is option 99, not 5.
So the verified answer is: D.
Refer to the exhibit.
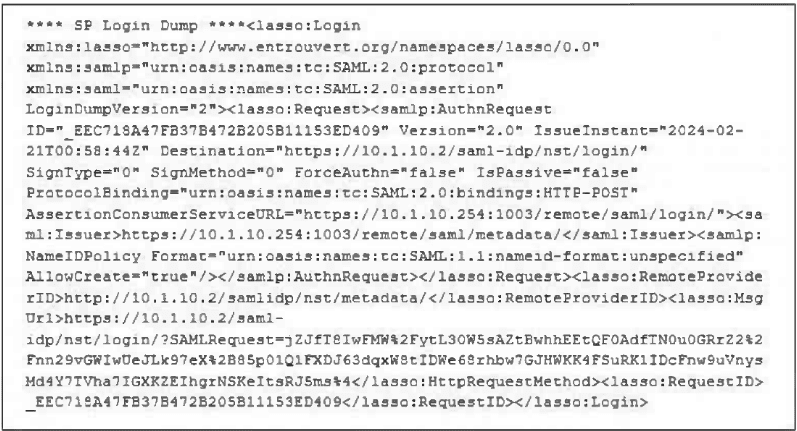
The output from using the command diagnose debug application samld -1 to diagnose a SAML connection is shown. Based on this output, which two conclusions can you draw? (Choose two answers)
The correct answers are B and D.
The study guide explains that in the SP Login Dump section, FortiGate is acting as the service provider (SP), and that you should read these fields:
''The IdP SSO URL, from the setting idp-single-sign-on-url in the FortiGate configuration''
''The SP SSO URL, from the setting single-sign-on-url in the FortiGate configuration''
''The IdP Entity ID, from the setting id-entity-id in the FortiGate configuration''
''The SP Entity ID, from the setting entity-id setting in the FortiGate configuration''
In the exhibit:
Destination='https://10.1.10.2/saml-idp/nst/login/' this is the IdP SSO URL
<lasso:RemoteProviderID>http://10.1.10.2/samlidp/nst/metadata/</lasso:RemoteProviderID> this is the IdP Entity ID
AssertionConsumerServiceURL='https://10.1.10.254:1003/remote/saml/login/' this is the SP SSO URL
<saml:Issuer>https://10.1.10.254:1003/remote/saml/metadata/</saml:Issuer> this is the SP Entity ID
The same study-guide example shows this exact mapping pattern, where:
Destination points to the IdP
AssertionConsumerServiceURL and Issuer point to the SP
Therefore:
10.1.10.2 is the IdP D
10.1.10.254 is the SP B
So the verified answers are: B, D.
Get access to all 134 verified questions with detailed answers.
Unlock All FCSS_NST_SE-7.6 Questions